In my role as Senior Application Developer at Highland, I’ve been doing a lot of dabbling with React Native and the open-source toolchain Expo and found myself feeling pretty positive in general about the experience.
I’ve been searching for a good framework that feels polished and is relatively easy to set up and get going with — an experience I found to be lacking when attempting to setup NativeScript + Vue. Although I really love Vue, the NativeScript implementation just seemed buggy and lacking in documentation. There were a couple of hiccups along the way, namely acquainting myself with all the deployment processes for the App Store, but overall I really like Expo and React Native.
All in all, I think React Native and Expo are a solid choice for doing cross-platform development of mobile applications. There have been a few minor shortcomings — namely the wallet API for iOS — that do not have a plug-and-play solution. If I were in a position that I needed those native components the cool thing about React Native is you can write your own components in their respective native language, in this case I could have written a component in Swift to do what I wanted if I was truly determined.
Naturally then as part of the development process, I came to a point where I wanted to debug my application. Once again this was fairly easy and I was successfully debugging after getting past a few very minor molehills. I’ll show you how I did it — feel free to code along as you’re reading.
First, start up the metro bundler process by running npm run ios or npm run android in your project’s root directory. Really these two commands are fundamentally the same for debugging purposes (unless you’re trying to debug a feature specific to one platform or the other). One will launch the iOS simulator, the other will launch the Android simulator.
Now let’s configure the debugger in VSCode.
1. Install the extension “React Native Tools” from the extensions tab in VSCode.
Now let’s add a debugger configuration for React Native iOS.
Click on the bug tab in the left navigation toolbar in VSCode. Now click on the gear icon next to the drop-down at the top of the debug window. This will open up a JSON file where the different debug settings can be configured. Click the menu titled “Debug” in the main application menu bar and then select the option “Add Configuration.” A context menu will appear in the editor pane. Select the option “React Native: Attach to packager.” Leave everything as is (it should be correct out of the box), then save and close the JSON file.
3. ChangeChange metro bundler port to 190001
This is where I hit a little snag in the process. Out of box React Native Tools wants to connect to the metro bundler process on port 19000, but expo seems to run it on 19001 by default. To get around this, go to Code > Preferences > Settings in the main application menu in VSCode, this will open your editor settings. Click the three dots on the right side of the Settings screen that opens and select “Open settings.json.” In the right pane of the editor that opens, be sure the “User Settings” tab is selected and add the following line to your JSON structure:
”react-native.packager.port”: 19001
This will tell React Native Tools to use port 19001 when connecting to the bundler process for debugging.
4. Start debugging
Now let’s start the debugger in VSCode. Make sure the metro bundler process is running in your terminal first (what we started by running npm run ios). Then click to the debug tab in VSCode and select “Attach to packager” from the drop-down at the top of the debug window. Click the green arrow. This will attach VSCode to the metro bundler process in the terminal we started and allow us to bridge data from the simulator to the debugger.
The final step in the process is to return to the simulator and enable remote JS debugging. Click over to the simulator, and hit Command + D to bring up your expo options menu. The very last option on this screen is called “Debug Remote JS” — click it to toggle on remote debugging.
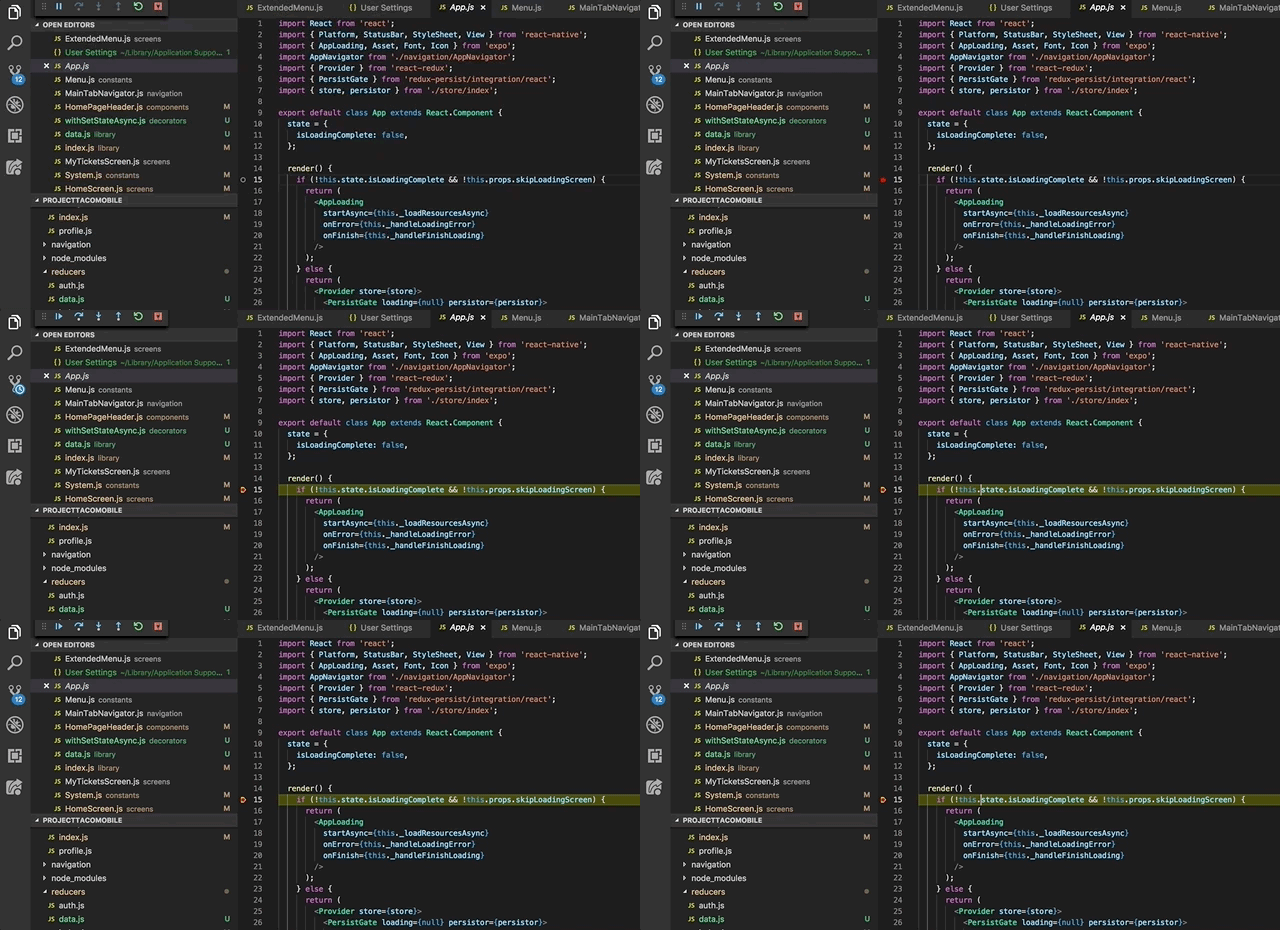
Let’s add a breakpoint to our code in VSCode. Click to the left of the line number where you want to add a breakpoint and a red dot will appear. I’ve added my example breakpoint to the main App.js file in the render method.
Now let’s see it in action! Go back to your simulator, open the expo menu by pressing Command + D, and choose the option “Reload JS Bundle.” Switch over to VSCode and presto, you’ve triggered your breakpoint!
That’s all there is to it! If you have any questions or feedback feel free to drop me a line in the comments. Happy coding!
Looking to grow your business with the right technology? Learn more about Highland’s approach to custom software development.


